The Worldmaking Lens · An interactive reading
Ocean Data Science Initiatives don’t just show us the sea — their mapping choices decide what we see, what stays hidden, and which problems look urgent. Explore how the same phenomenon becomes many oceans.
Companion to “Mapping ocean worlds through the data revolution” — Melvin, Zurita Posas, Carmine, Havice & Campbell, Political Geography (2026). ↗Why this matters
An interactive map feels neutral — a window onto what’s really out there. But every map is a stack of choices: which data to show, as points or polygons, in red or in blue, at what scale, within whose borders. Change the choices and you change the ocean the viewer comes to know.
We read 132 maps from 43 ODSIs. Below are two of the clearest cases — where organizations looking at the very same thing built strikingly different ocean worlds.
Both maps below show Papahānaumokuākea Marine National Monument, one of the largest protected areas on Earth. One organization draws it as a shape; the other as a dot. Watch what each decision does to how big — and how important — the reserve appears.
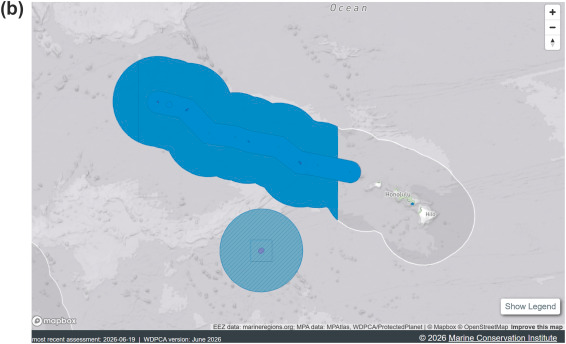
By mapping the monument to its actual spatial extent, MPAtlas makes large reserves prominent — and quietly makes small coastal MPAs vanish at a global scale.
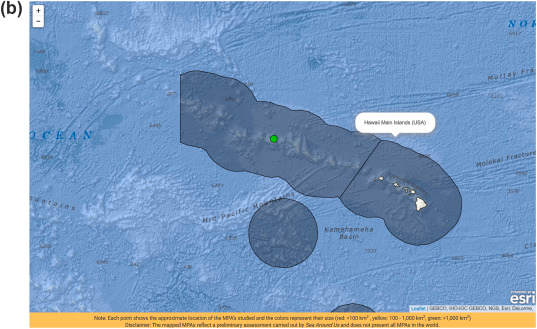
By mapping every MPA as an equal-sized point, Sea Around Us keeps the smallest coastal reserves visible on a global map — but a giant monument now looks no larger than a tiny one.
Three ODSIs map fishing pressure — and answer that question three different ways. Pick an answer and see which map tells that story. There is no single truth here; each map is a choice about where our attention should go.
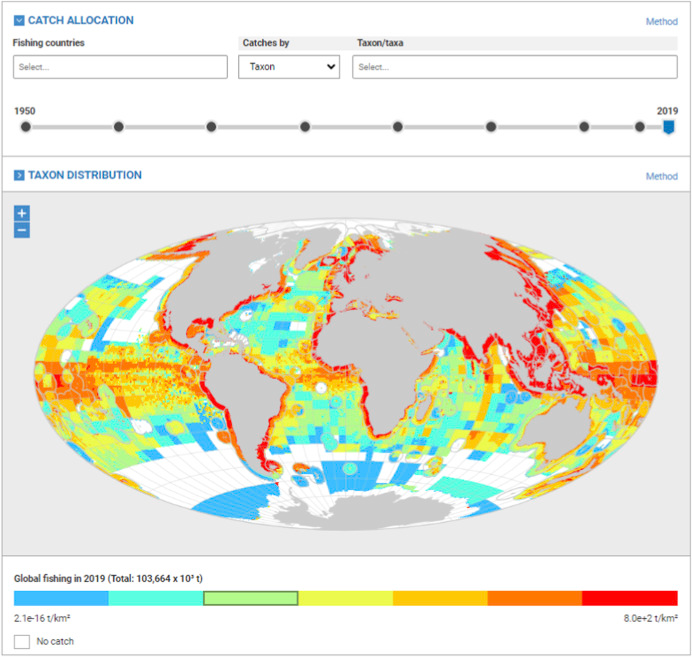
Catch density blazes red along nearly every coastline and cools to blue offshore — overfishing reads as a worldwide, coastal problem.
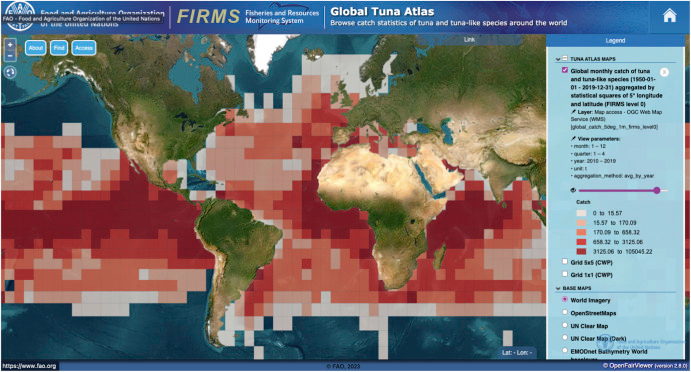
Red spreads across the tuna’s entire range — far beyond any coastline or border — framing the problem as one no single nation can fence in.
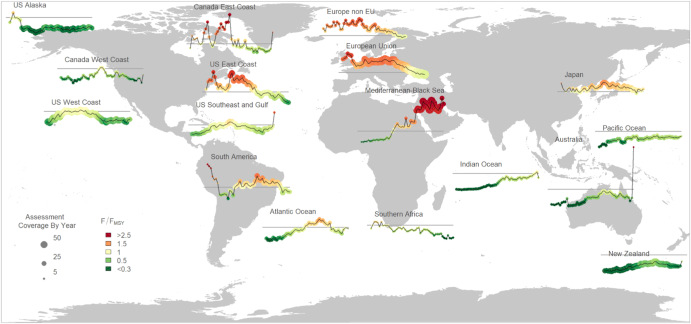
Measured against sustainable yield, most regions sit green — only the Mediterranean and Black Sea flare deep red, making overfishing look local, not global.
The bigger picture
Across the maps we studied, ODSIs’ choices produced four recurring kinds of ocean — each one shaping which data seem to matter, and which forms of governance seem possible.
The ocean as an empty slate, ready for data to be projected onto it.
The ocean carved by borders — the nation as the unit that counts.
The ocean in red — danger made visible to move public attention.
The ocean as somewhere increasingly known — the data itself as the story.
These aren’t neutral pictures. They are arguments about “the science we need for the oceans we want” — and ODSIs are among the actors making them.
This page reads two maps closely. The same method, run across the whole catalog, could grow into a living tool for seeing how ocean data initiatives make ocean worlds.
Two hand-built comparisons — one protected area, one threat — proving the concept and the DOGL look.
PrototypeA filterable directory of all ~94 ODSIs and 132 maps — by who runs them, what they map, how much users can customize, and which ocean world they build. Each links to the live tool.
Extend the lens beyond MPAs and overfishing to any phenomenon, generated straight from the published map-level dataset rather than built by hand.
Surface what the maps leave out — human relations, Indigenous knowledge, waters beyond national borders — and keep the catalog current as tools change.
This is a working prototype: enough to feel the idea and check the DOGL look, not a finished public page. Here’s the honest status.